The fable object
UKLungDeaths %>%
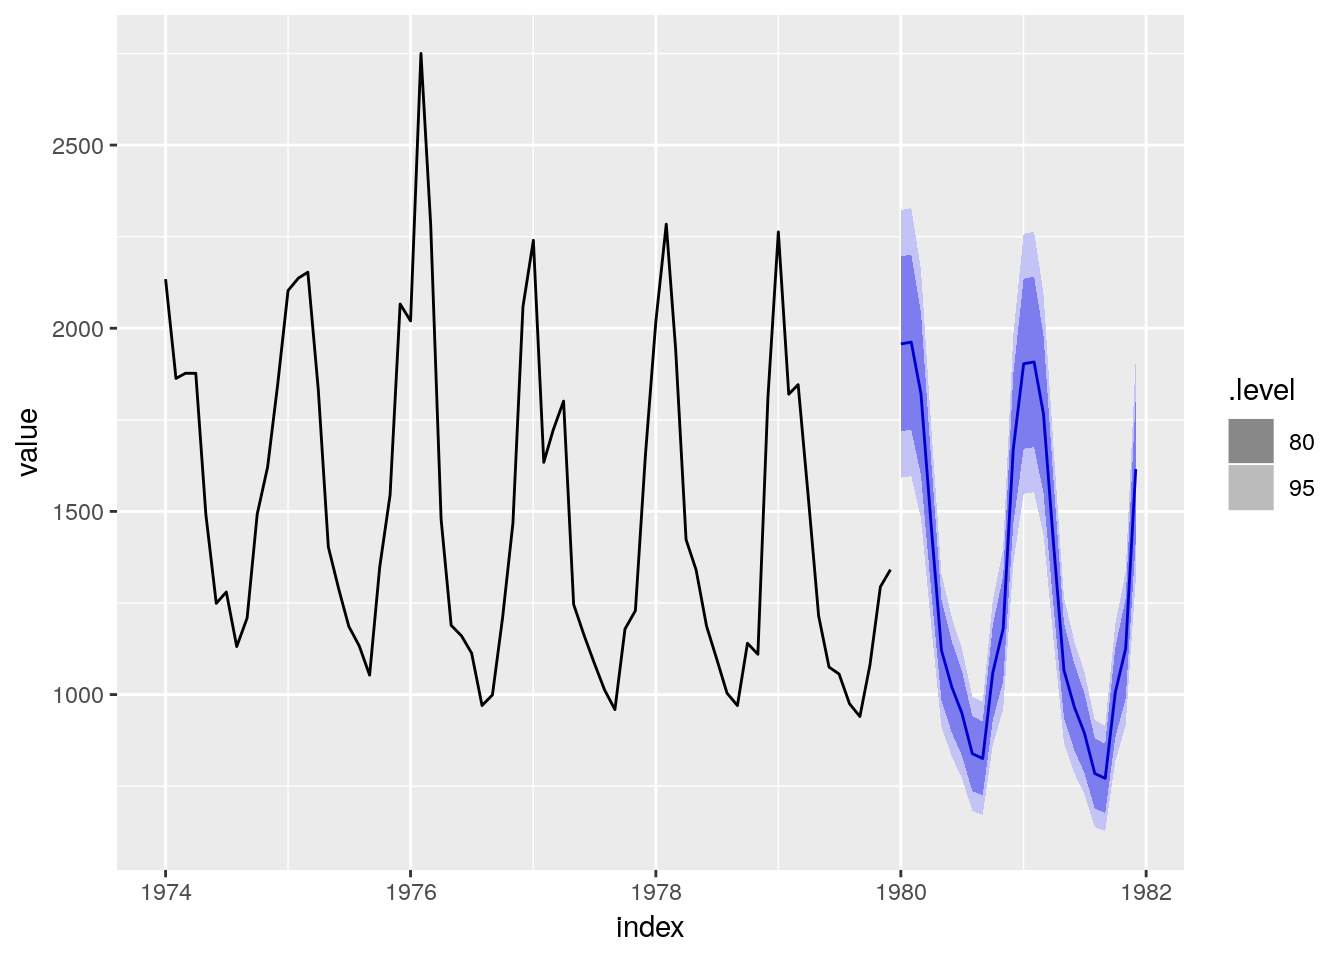
model(ETS(mdeaths)) %>%
forecast()
## # A fable: 24 x 4 [1M]
## # Key:     .model [1]
##    .model        index value .distribution
##    <chr>         <mth> <dbl> <dist>
##  1 ETS(value) 1980 Jan 1957. N(1957, 34666)
##  2 ETS(value) 1980 Feb 1962. N(1962, 34842)
##  3 ETS(value) 1980 Mar 1821. N(1821, 29997)
##  4 ETS(value) 1980 Apr 1455. N(1455, 19154)
##  5 ETS(value) 1980 May 1121. N(1121, 11370)
##  6 ETS(value) 1980 Jun 1020. N(1020,  9419)
##  7 ETS(value) 1980 Jul  949. N( 949,  8151)
##  8 ETS(value) 1980 Aug  839. N( 839,  6363)
##  9 ETS(value) 1980 Sep  825. N( 825,  6165)
## 10 ETS(value) 1980 Oct 1060. N(1060, 10160)
## # … with 14 more rows
- Index
- Mean (backtransformed and bias adjusted)
- Standard error (may not be needed)
- Distribution